Quick Answer:
Cryptocurrency technical analysis is a vital tool for traders to predict market movements by examining historical data. Unlike fundamental analysis, which considers economic variables, technical analysis looks at patterns and statistical tools to assess an asset’s future worth. The Dow Theory, developed by Charles Dow, is foundational to technical analysis, emphasizing that price reflects all known market information, trends dictate market direction, and historical price movements tend to repeat themselves.
Reading crypto charts is essential for understanding market trends and predicting future price actions. The Japanese Candlestick Chart is the most popular, showing open, close, high, and low prices within specific intervals. Bullish and bearish patterns, like the Bullish Hammer and the Bearish Three Black Crows, help identify potential market movements. Market capitalization, calculated by multiplying total circulating supply by the price of each coin, indicates a cryptocurrency’s stability or volatility.
For those new to crypto trading, exchanges are platforms where you can buy and sell cryptocurrencies. Short-term trading involves holding assets for a brief period and can yield large profits but is risky due to market volatility. Long-term trading involves holding assets for an extended period, potentially leading to significant price increases. Successful trading strategies include shorting after price pumps, accumulation, leveraging, and diversification, spreading investment across various assets to manage risk.


It seems like 2020 is going to be big for the crypto industry. We simply need to turn to Internet trends or recently conducted surveys to see the bigger picture.
Only last month, State Street released a survey that shows 94% of its clients hold cryptocurrencies and 38% plan to invest more money into these assets in 2020. Even more encouraging are the results of an endowment funds survey, with an amazing 94% stating they’ve put money in crypto assets last year.
If one of your plans for 2020 is to get involved in crypto trading and make your first investment, what you need to do first is a thorough cryptocurrency analysis. Now, there are two types of cryptoanalysis that you can perform – fundamental and technical.
Fundamental analysis looks at the intrinsic value of a cryptocurrency to evaluate whether it’s worth investing in based on its economic variables. Technical analysis looks at the history of the asset in terms of its price volatility and liquidity to predict its future price movements.
This guide covers the essentials of crypto technical analysis, crypto charts and how to read the most common chart patterns, plus an introduction to crypto trading.
Excited already? Let’s begin!

What Is Technical Analysis?
Why is crypto technical analysis crucial for future and current investors? Well, mainly because it’s their secret weapon that protects them from unexpected movements and trends in the industry. It’s a methodology that evaluates their chances of success by analyzing market statistics.
Contrary to what a fundamental analysis does, a technical one has no interest in the underlying value of a digital coin and focuses instead on other variables and patterns that indicate it’s long term worth.
Technical analysis involves the prediction of future exchange rate movements from an inductive analysis of historical time series using quantitative techniques. Technical analysis is not rooted in underlying financial theory, but relies solely on recurring past exchange rate patterns. As, according to the efficient market hypothesis (Fama 1970), past information should already be embodied in current prices, persistent performance of technical trading rules is surprising. (Joris Bakker. 2017. Technical Analysis in the Cryptocurrency Market. Erasmus School of Economics, Rotterdam)
Technical analysis gravitates towards the future and is always on the lookout for the most efficient predictor. Paradoxically, that seems to be the past trading data of a given coin. That’s why this type of analysis relies on the use of performance charts, trends and patterns, and statistical tools such as indicators and oscillators.
The Dow Theory and Technical Analysis
In the 19th century, Charles Dow helped popularize technical analysis in the West. He developed a theory known as Dow Theory where he explains price movements on the stock market. According to this theory, technical analysis is governed by the following principles:
Price discounts everything
According to technical analysts, the market price which sustains the equilibrium among buyers and sellers reflects all the information available to the participants in that market and everything that can affect the market itself. These factors can be economic, political, and psychological. They include news stories, reliable economic data, geopolitical events, even the psychological state of traders or natural disasters.
What’s important for the technical analysis is the direction in which prices move and not the factors that cause these changes.
Prices move in trends
Another principle important for technical analysis is the market trend. Once a new trend has been established, the prices will follow that trend and move in the same direction in the future.
History repeats itself
As far as price movements are concerned, history tends to repeat itself. That’s what makes them more or less predictable and easy to interpret for analysts.
The technical analysis pays close attention to the accumulated historical data and traces chart patterns to predict future price movements. The study of market psychology has shown that traders react in the same way to similar market events.

How to Read Crypto charts
Crypto charts are commonly used in technical analysis because they reflect current trends and patterns and help us predict future price movements. Knowing some of the main principles included in the Dow Theory can help you become an expert in reading these charts.
Types of Market Movements
According to Dow, the market experiences three movements or trends:
Primary movement (The tide)
Primary movements show major trends that can last less than a year or up to several years. When there’s a surge in prices, we have a rising or bullish market, as opposed to a falling or bearish market when the prices are going downwards. Therefore, primary trends themselves can be bullish or bearish.
Note: Buyers are also known as bulls because the crypto prices rise in proportion to their buying, whereas sellers are known as bears because they lower the prices by selling the coins.
Secondary movement (The waves in the tide)
Secondary or intermediate trends are medium swings and corrections in the primary trend that can last anywhere from three weeks to three months and backtrack around one- to two-thirds of the last major trend.
Minor movement (The ripples)
Minor trends are short movements within the secondary ones that can last from a few hours to less than three weeks.
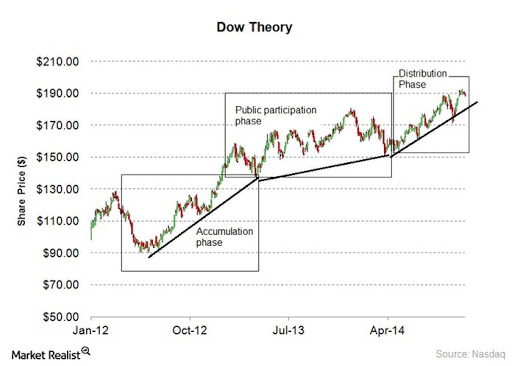
Phases of a Major Trend
The primary trend has three phases:
Accumulation phase
This is the first stage when experienced investors start buying or selling a currency because they feel that a turning point is bound to happen. These investors represent a minority on the market, so the price of the coin remains almost the same during this phase.
Public participation phase
The next phase has more and more investors on the market catching up on the new trend as the price (and demand) starts to rise rapidly.
Distribution phase
The last phase occurs once the trend has reached its peak and demand is at its highest, so the volume of the coin starts decreasing. The investors that predicted the trend begin to distribute their holdings to the market.
Cryptocurrency Market Cap
The market cap of cryptocurrency is an indicator of its stability or volatility. We use the following formula to calculate it:
Market capitalization = Total Circulating Supply * Price of each coin
So, for example, if Bitcoin has 500,000 coins in circulation and each one of them is worth $5, then then the Bitcoin market cap will be 500,000 * 5 = $2,500,000. This can be easily checked on websites like coinmarketcap.com which lists the market cap of the top 100 cryptocurrencies.
Let’s see the market cap of Bitcoin for the past month:
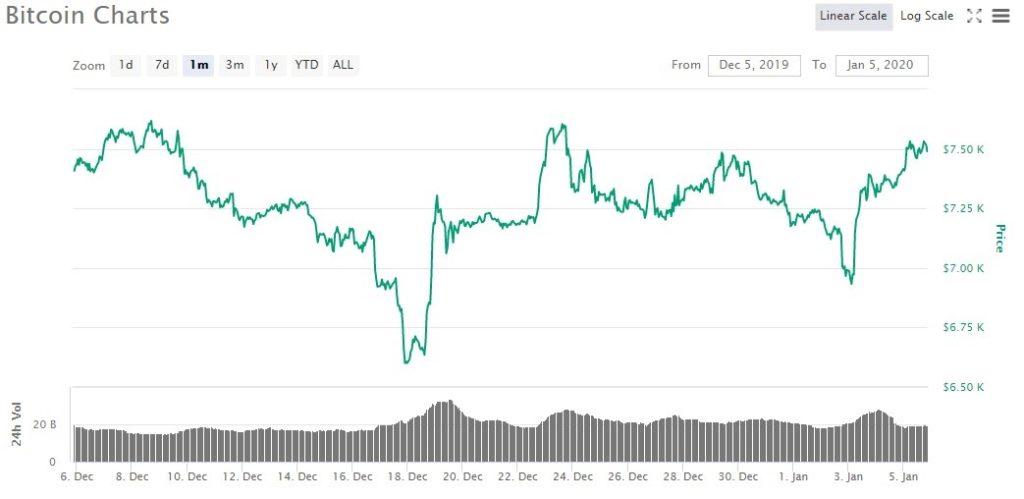
As we can see, Bitcoin experienced some ups and down, meaning it was surprisingly volatile towards the end of 2019.
Japanese Candlestick Charts
The most popular type of chart is definitely the Japanese Candlestick Chart where everything we need to know about the price movement of a given cryptocurrency is reflected in each of the candlesticks. The graph below is taken from Binance and it represents their daily candlestick chart for BTC/USDT.
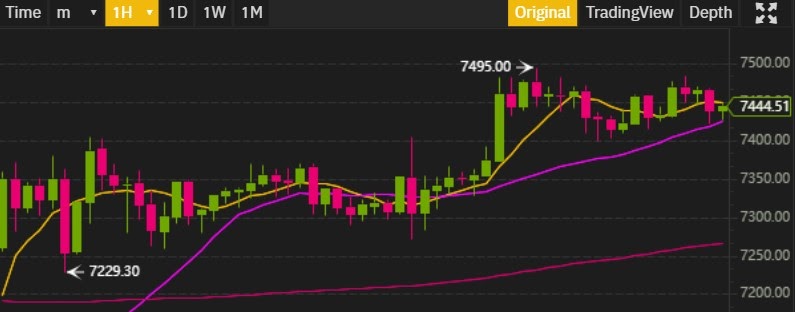
A single candlestick stands for the price activity of a coin during a specific time interval. Their bodies can be green or red, bullish and bearish respectively.
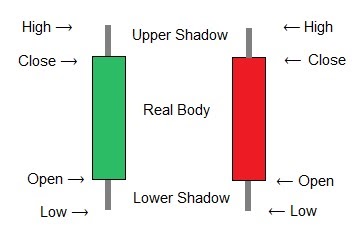
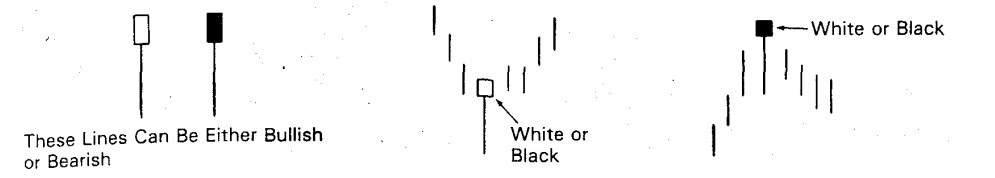
Candlesticks express different things according to the position of their four components: the open, close, high, and low.
The “open” shows the price of the coin when the trading period started, whereas the “close” shows the final price when that period ended. The “high” and “low” denote the highest and lowest prices the coin had reached during that time and can be identified by looking at the thin grey wicks on both ends of the candlestick body. This is illustrated in the visual below:
These types of charts were brought to the Western world by Steve Nison in his book Japanese Candlestick Charting Techniques, published in 1991. In continuation, we’re going to explain the five most common patterns so that you can see these candlesticks in action. The illustrations are taken from Nison’s book (white candlesticks are bullish, black ones are bearish).
The Bullish Hammer
The bullish hammer it’s characterized by a long wick at the bottom and a short body. It indicates the bottom of a trend and shows that bears have pushed the price down in that time interval. It’s even more effective when preceded by at least three declining candlesticks, and confirmed when followed by one that closes above the closing price of the hammer which indicates increased buying.
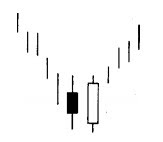
The Bullish Engulfing Candlestick
The Bullish Engulfing Candlestick shows a bullish candlestick completely engulfing the body of the previous bearish candlestick. What this represents is a reversal in trend due to buyers entering the market and pushing the prices up. Ideally, traders should wait and see if the price continues to rise with the following candlesticks.
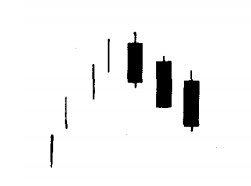
The Three Black Crows
The Bearish Three Black Crows pattern consists of three descending black candlesticks that start near the high of a trend or at the high itself. It indicates that the price goes lower under pressure of the bears in each of the three sessions, and predicts a downtrend.
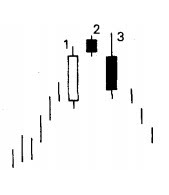
The Evening Star
The Bearish Evening Star begins with a long white candlestick followed by a short black one that takes the uptrend a step higher. When new buyers fail to enter the market at this point, a third declining black candlestick appears. This usually signifies that a broader-scale downtrend is bound to take place on the market.
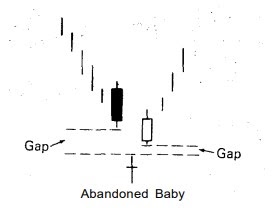
The Abandoned Baby
Found at the low of a downtrend, the Bullish Abandoned Baby is a pattern that comes after a couple of descending black candlesticks. If new sellers are missing on the market, a narrow range doji candlestick appears whose open and close prices are the same. A bullish candlestick completes the pattern and indicates an uptrend on the lookout.
Cryptocurrency Trading for Beginners
Now that you’re on your way to become a proficient reader of crypto charts and a keen follower of the crypto market, you might want to test these newly acquired skills with some real crypto trading.
If you want to trade cryptocurrencies, you need to use a cryptocurrency exchange. Nowadays, there are thousands of these platforms and choosing the right one can be quite a challenge.
If you’re a beginner and don’t have any cryptos yet, you should choose one that allows you to convert your fiat currencies into crypto ones. Crypto exchanges match buyers of a certain digital coin with sellers of that coin, and similar to banks, they request transaction fees for their services.
Types of Crypto Trading
There are two main types of crypto trading:
Short-term trading. Purchase cryptocurrencies but hold on to them for a short time only.
Advantages: You can make large profits thanks to the volatility of the crypto market. Just make sure you pick a coin with high trading volumes, which means there’ll always be buyers and sellers.
Disadvantages: The market volatility can also be tricky, so short-term trading requires careful analysis of the market and price movements. Moreover, this type of trading usually works better with large investments.
Long-term trading. Purchase cryptocurrencies and hold on to them for a long time.
Advantages: This type of trading doesn’t require you to spend a lot of time analyzing the market nor to make large investments. You simply wait. Over time, those new obscure digital coins you’ve decided to gamble with and invest in, can see their prices skyrocket.
Disadvantages: Have you heard of FOMO? The fear of missing out? Well, long-term trading can cause you just that – you might miss some really good short-term gains.
Crypto Trading Strategies
Shorting After Pumps
One of the best short-term strategies is to short after pumps. In crypto lingo, “pumps” refer to a drastic price increase over a short period of time followed by a downward slope. This is known as “mean reversion” and it means that it’s highly likely for the prices to return to their average mean.
Therefore, investors should wait for a pump to reach its peak and then short the asset for better chances at a profitable ROI.
Accumulation
Accumulation is a long term strategy where traders purchase and hold on to as many digital coins as they can over a longer period of time. That way, when a sudden fall in price takes place, they won’t have to sell what they own in panic, but wait for a moment when the prices are the highest.
Leveraging
There are some platforms that allow you to engage in leverage or margin trading. This is a powerful but risky strategy where the trader can invest only a certain amount of the whole investment and amplify that portion with borrowed capital to increase potential returns.
This means that you can trade bigger volumes using a limited amount of your trading capital.
However, this is only recommended for knowledgable traders that are aware of all the risks and know how to avoid them.
Diversification
Ever heard of the phrase “don’t put all your eggs in one basket”? Well, that’s exactly the philosophy behind this strategy. Diversification means widening the scope of your interest in digital coins by exploring as many as you can to find those that are the most promising. Next, traders allocate different percentages to different assets based on their volatility and liquidity and the trader’s tolerance for risk.
About The Author

James Page, previously the lead writer at Crypto Head and a registered psychologist, brings a unique perspective to the world of blockchain and cryptocurrency.
His extensive experience in the industry and ability to present complex concepts in an understandable manner make his articles a valuable resource for readers seeking to navigate the ever-evolving crypto landscape.
Check James out on: